.png)


ONE’S NEW JCV SERVICE OFFERS A DIRECT CONNECTION FROM JAPAN/CHINA TO VIETNAM
Ocean Network Express (ONE) has announced a new service connecting Japan and China to Ho Chi Minh City, Vietnam. The new Japan - China -Vietnam (JCV) service has been developed to further enhance ONE’s Inter Asia Network. It will be the first direct service from Shanghai to Ho Chi Minh and will increase the frequency of sailings between Japanese ports and Vietnam. The first sailing will commence from Tokyo on 15th of October 2020.
Japan China – Vietnam (JCV) rotation is as follows:
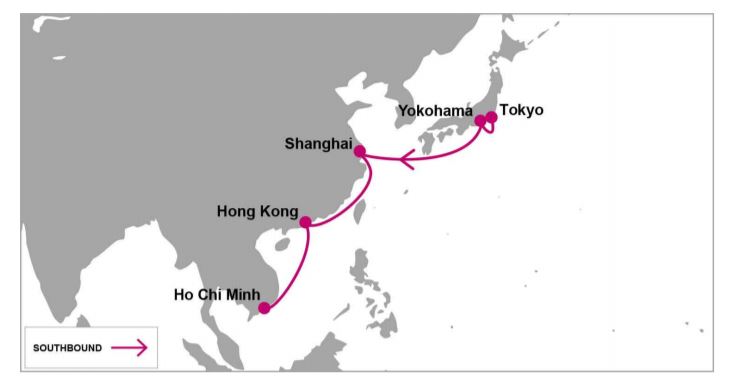
Tokyo – Yokohama – Shanghai – Hong Kong – Ho Chi Minh City (Cat Lai)
First vessel: WAN HAI 263 S303 (Tokyo 15th October 2020)
THE ALLIANCE ANNOUNCES COVID-19 RESPONSE MEASURES FOR OCTOBER 2020
The members of THE Alliance would like to update the latest service adjustments in October in response to the demand changes in global shipping market amidst the COVID-19 pandemic and the Chinese Golden Week holidays in early October. For more details, please refer here.
HMM cooperates with SHI to develop smart ship technology
HMM has signed a Memorandum of Understanding (MoU) with Samsung Heavy Industries (SHI) on smart ship technology. Under the MoU, HMM and SHI will collaborate in the research, development and innovation in the field of smart ship solutions.The MoU mainly covers the development of eco-friendly technologies applicable for smart ships and the enhancement of technological competence related to the digitalisation of ships.As part of this partnership, HMM has adopted ‘SVESSEL’, the most advanced smart ship solution eveloped by SHI.
The cloud-based ‘SVESSEL’ has been applied to five out of twelve 24,000 TEU mega containerships delivered to HMM this year. HMM will test operational data on its own container vessels.
HMM official said, "Both digitalisation and decarbonisation have become integral factors on the pathway to sustainable growth. HMM has concentrated on the exploration of new technologies for the future and has actively participated in various discussions with the parties concerned.” and that “We look forward to taking this partnership to the next level with great synergy.”
In addition, HMM is preparing to operate a ‘Smart Ship Control Centre’ that enables to monitor the safety and efficiency of ships in real time based on an extensive range of data including cargo information, service routes, locations, ocean weather and vessel conditions.The centre is scheduled to be in full operation from mid-September this year.
About SVESSEL: SVESSEL is the latest smart ship solution designed by Samsung Heavy Industries in the face of increasing demands for digital transformation. SVESSEL aims to expedite the transition from analog-based conventional ships into "Intelligent and Life-cycle managed Ships" through the gonvergence between ICT and Ship Operational Technology. This solution provides a variety of features such as vessel & fleet tracking, onboard data analysis, collaborative maintenance, monitoring of propulsion performance and so on.
(Source : https://shi.svessel.com/)
Red-hot ocean rates could spark government intervention
In tanker and dry bulk shipping, the rate is the rate. It’s whatever the market says it is. It can be below zero (net of costs). It can be six figures per day. No government can intervene. This is definitely not the case in container shipping.
Record-high trans-Pacific spot rates and container-equipment shortfalls in Asia have now caught the eye of powerful government regulators. The China Ministry of Transportation and Communication questioned liner reps in a special meeting last Friday.
In the aftermath of that sit-down, concerns have been raised about carriers’ ability to implement general rate increases (GRIs) and “blank” (cancel) sailings while averting future government backlash.
“The meeting in Shanghai was not something anybody was expecting,” said Alan Murphy, CEO of Sea-Intelligence, in an interview with FreightWaves. “A lot of people had plans for the weekend that got canceled. Nobody was ready for that.
“I think the carriers are now mulling how best to address this,” he continued. “The carriers are not going to blindly ignore the Chinese authorities. You can’t do that.”
Rates are still sky high
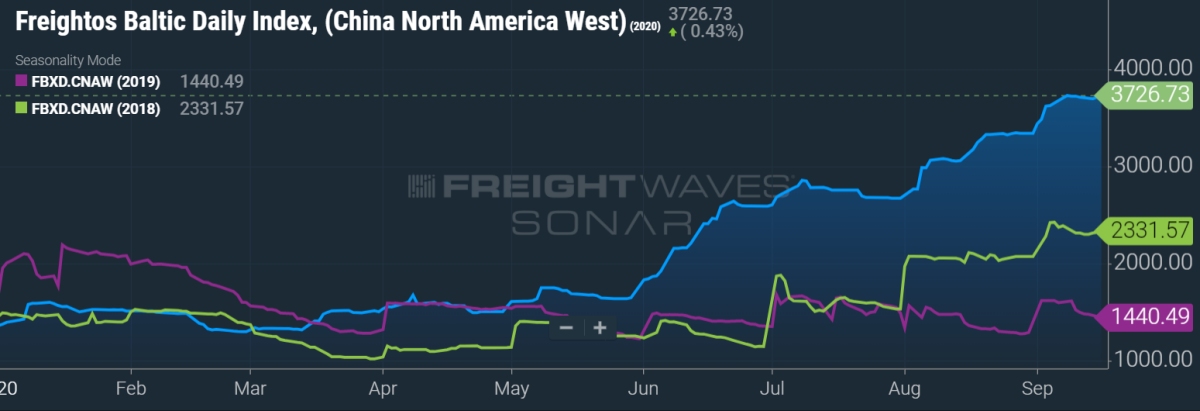
The Freightos Baltic Daily Index put Asia-U.S. West Coast rates (SONAR: FBXD.CNAW) at $3,727 per forty-foot equivalent unit (FEU) as of Wednesday, roughly flat over the prior week.
The weekly Drewry assessment that came out Thursday estimated the Shanghai-to-Los Angeles rate at $3,922 per FEU. The weekly Shanghai Containerized Freight Index (SCFI) was at $3,867 per FEU as of Friday — another record.
Steve Ferreira, founder of Ocean Audit, told FreightWaves that transport costs including premium or guaranteed slot fees are considerably higher. “The West Coast rack rate of $4,000 [per FEU] can go as high as $5,500,” he said. “It’s the premium fees on top of the $4,000 that are throwing fits into the BCOs’ [beneficial cargo owners’] budgets.”
Peter Sand, analyst at shipping association BIMCO, just released a comparison of Asia-West Coast spot and contract rates.
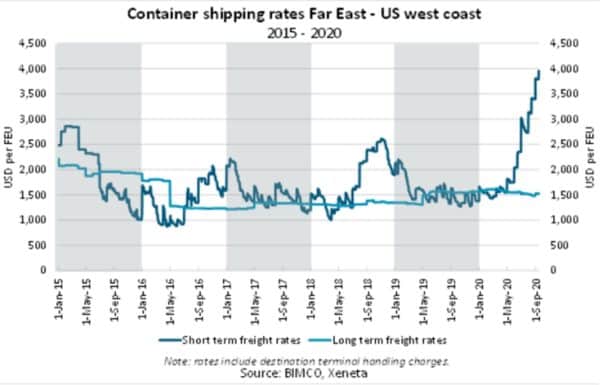
Using data from Xenata, he found that the difference between spot rates and the average long-term contract rate of $1,521 has jumped to a record $2,500 per FEU.
“Never before have we seen a gap this wide between spot freight rates and long-term contract rates on the Trans-Pacific trade lane,” said Sand.
“Now, more than ever, it is the carriers’ market. The coming weeks are likely to see higher long-term freight rates when contracts are up for negotiation and renewal,” Sand said.
Reversing course on GRIs?
Will pressure from the Chinese government cause liners to pull back on their barrage of GRIs, starting with the GRI implemented Tuesday? And will carriers reinstate blank sailings related to the Chinese Golden Week holiday?
Taiwan’s Evergreen withdrew its GRI on Tuesday. According to Ferreira, “As for COSCO, while they did not [yet] withdraw their U.S. publication of the GRI, [almost all] of their cargo is under service contracts, and they are able to uniformly exclude any quantum of the GRI from the service contract if they see fit, without filing it with the FMC [Federal Maritime Commission]. The same applies for all carriers. Evergreen just made it simple and cleaner admin-wise by saying they are withdrawing the GRI.”
In a market report on Wednesday, freight forwarder Flexport predicted that carriers would provide $100-$200 per FEU in “GRI mitigation before the end of the week” to lessen the cost of Tuesday’s $400-$600 per FEU GRI.
According to the analyst team at Fearnleys, “The meeting [in China] included inquiries about the pandemic, blank sailings and pricing mechanisms of the China-U.S. spot rates. Some also said that the authorities had asked the carriers to halt the GRIs for Sept. 15 and reinstate planned [Golden Week] blank sailings, however, according to one executive attending the meeting, no such explicit request was made.”
Golden Week blank sailings
The Chinese Golden Week holiday is Oct. 1-7. As they do every year, carriers blanked sailings to match capacity with the holiday-impaired exports.
Sea-Intelligence analyzed both the Asia-U.S. and Asia-Europe blank sailings for four weeks during and around Golden Week. It found that carriers are blanking more sailings to Europe this year than usual. In contrast, carriers are blanking roughly the same percentage of trans-Pacific sailings this year as the 2014-2019 average. They canceled fewer this year than last year.
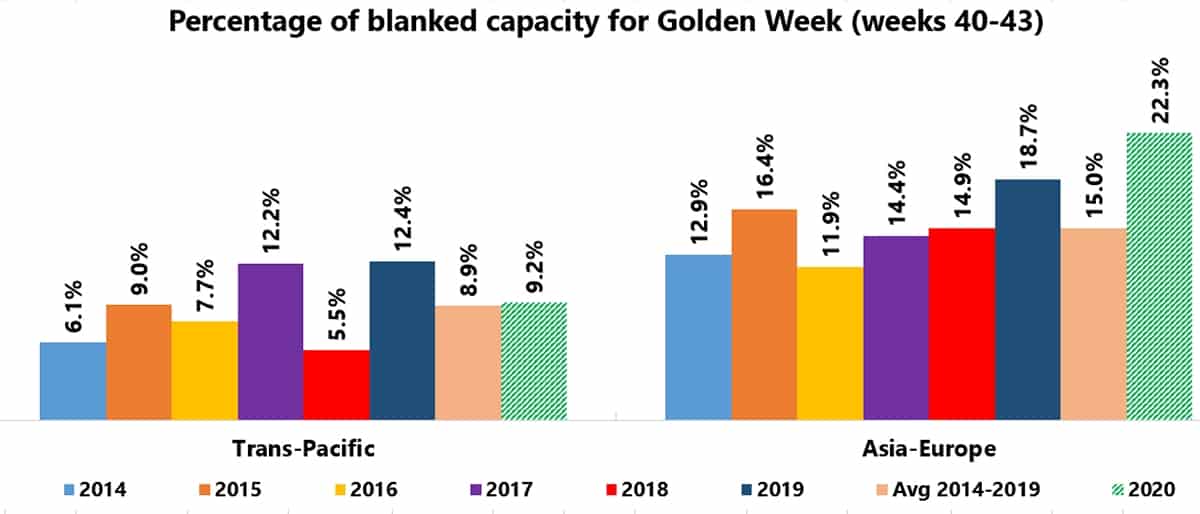
Chart: Sea-Intelligence Sunday Spotlight: Issue 480
“This is based on the outlook for blank sailings prior to any potential impact of the discussions the carriers have with Chinese regulatory authorities,” commented Lars Jensen, CEO of SeaIntelligence Consulting. “If this [meeting] leads to a curbing of blank sailings, the year-on-year capacity injection, especially in the trans-Pacific, will be highly significant.”
So far, carriers have announced only limited changes to Golden Week blank sailings. OOCL, owned by China’s COSCO, has reinstated six previously canceled sailings.
However, a Maersk spokesperson confirmed to FreightWaves late Friday that Maersk’s previously announced blank sailings for Golden Week will remain in place.
Risk of regulatory intervention
The big-picture question is how regulatory intervention — or merely the threat of intervention — could change carrier capacity-management behavior going forward.
“It is clearly negative for the carrier industry if China starts interfering in the pricing mechanism for containerized cargo,” said Fearnleys.
And it’s not just the Chinese regulators. In a statement on a closed-door meeting held Wednesday, the FMC warned, “If there is any indication of carrier behavior that might violate … the Shipping Act, the Commission … if necessary … will go to federal court to seek an injunction to enjoin further operation of the non-compliant alliance agreement.”
“The consideration of interventions shows just how extreme the last few months have been,” said Eytan Buchman, chief marketing officer of Freightos. “Whatever the outcome [of regulatory deliberations] … the threat of intervention will likely serve as a warning to carriers moving forward to use their [capacity] controls wisely.”
In the second quarter, carriers booked big profits by blanking sailings in response to coronavirus-reduced imports. (Carriers ultimately took out too much capacity, but they claim it was unintentional.)
Carriers reinstated all of the trans-Pacific capacity in the third quarter and added even more, albeit not enough to satiate U.S. importers.
But pressure on consumer demand from unemployment could once again lower cargo demand in the months ahead. Analysts warned of trouble brewing following Wednesday’s Commerce Department release of August retail sales numbers, which showed a slowdown in momentum. That could lead to more tactical blank sailings in the future.
The next wave of blank sailings
Murphy of Sea-Intelligence explained to FreightWaves, “There have been two unprecedented situations this year. One is the coronavirus. The other is that the carriers managed to keep rates up.
“We had assumed rates would crash, because it happened every time in the past. If there were three things you could be sure of it was death, taxes and carriers will crash the market as soon as the volumes start tanking.
“There are two reasons they haven’t. Number one, consolidation. There are fewer carriers around the table. Number two is that it’s technically possible to institute tactical capacity cuts much faster than you could 10 years ago or even five years ago. Now you can blank a sailing with one week’s notice.
“I just don’t believe the carriers can stop blank sailings,” said Murphy. “I think if the Chinese were to set up some very stringent rules [on blank sailings], the carriers would need to find a way to formally meet the requirements, but practically not. To follow the letter of the rules but not necessarily the intent. That’s what I think. Because you’re talking about taking away the only thing that has really worked for the carriers in the last 10 years.”
CMA CGM posts strong Q2 profits, predicts even stronger Q3
Another container-line quarterly report, another surprisingly big profit announcement in the midst of the coronavirus pandemic. Second-quarter results of France’s CMA CGM followed the same pattern as Maersk. Volume down, revenue down, costs down even more, so profits up.
On Friday, CMA CGM reported net income for the group of $136 million for the second quarter of 2020 (Q2 2020) versus a net loss of $109 million in Q2 2019.
Shipping division performance
CMA CGM’s container-shipping division carried 4,781,000 twenty-foot equivalent units (TEUs) of volume in Q2 2020. That was down 13.3% year-on-year, bringing shipping division revenues down 10.9% to $5.318 billion.
Revenue per TEU was $1,112, up 2.8% year-on-year.
Unit cost per TEU in Q2 2020 was $892, down 4.6% year-on-year. Unit cost fell due to “the decline in oil prices, cost-cutting initiatives and the reduction in vessels and containers deployed,” said the company.
Thanks to lower costs and higher revenue per TEU, the division’s earnings before interest, taxes, depreciation and amortization (EBITDA) came in at $1.052 billion, up 30% compared to Q2 2019.
“CMA CGM demonstrated its ability to rapidly adapt its deployed capacity to demand, in line with the discipline seen more generally across all industry operators,” the company said.
Q3 should top Q2
“Despite COVID-19, our group reported excellent results, thus strengthening our financial structure,” asserted CMA CGM Group CEO Rodolphe Saadé. He highlighted the company’s agility, synergies between shipping and logistics, and “significantly reduced” costs.
Expect more positive news in the current reporting period. “Third-quarter results should mark a new improvement in our performance,” predicted Saadé.
The company said, “The current strong momentum of the shipping market, driven by both volumes and freight rates, should allow the group to further significantly improve operating margin compared with the second quarter.”
Bonds rebound
Investor sentiment on CMA CGM’s liquidity position has greatly improved. Less than six months ago, some market watchers were worried about the carrier’s survival. In a research note on March 23, Stifel analyst Ben Nolan included CMA CGM on his insolvency “risk list,” noting that it had debt trading at 72 cents on the dollar.
CMA CGM’s 6.5% coupon bonds due in 2022 actually hit a low of 55 cents on the dollar on March 20. On Thursday, they closed at 99 cents — they’ve come all the way back to par. For someone who timed it perfectly, that’s a return of 80% over five and a half months.
New data trove reveals how COVID hit world trade
Track all the ships in the world. What they’re carrying, where they’re loading, where they’re unloading. Create a near-real-time map of how all commodities and goods flow across the globe. This is the holy grail of ocean shipping data — one that companies such as Cargometrics, VesselsValue, Kpler, IHS Markit (NYSE: INFO) and others have pursued for years.
This data is more valuable than ever in the age of coronavirus — and now there’s a new source. One that’s actually free.
The new offering developed by International Monetary Fund (IMF) economists Diego Cerdeiro and Andras Komaromi and IMF data scientists Yang Liu and Mammon Saeed was announced in May and is now fully available to the public and updated weekly.
The IMF staff’s “nowcasting” research offers a 30,000-foot view of how COVID-19 has reshaped trade flows. If it works as intended, it will offer an early warning system to governments, and by extension, companies and investors.
Measuring fallout
The platform utilizes automatic identification system (AIS) shipping-position data collected by MarineTraffic. It assesses import and export vessel capacity measured in deadweight tons (DWT) by country and ship type. It then uses machine-learning algorithms to estimate metric tons of cargo carried.
The updated capacity and cargo tonnage numbers are available for download via UN Comtrade (see link for access).
To gauge coronavirus fallout, FreightWaves downloaded the year-to-date (YTD) export data for 2020 and the comparable period last year for tankers, dry bulk, containers and the overall global fleet.
Cargo volumes are highly seasonal, so FreightWaves looked at the numbers two ways: first, the change in daily volume versus the same day in 2019; and second, the change in YTD volume versus the same period the year before.
Global export effects
Global exports show two “valleys.” In the first quarter, a supply-side shock stemming from the initial outbreak in Wuhan, China, coinciding with seasonal dry bulk weakness. In the second quarter, a slide coinciding with the demand-side shock of consumer lockdowns in Europe and the U.S.
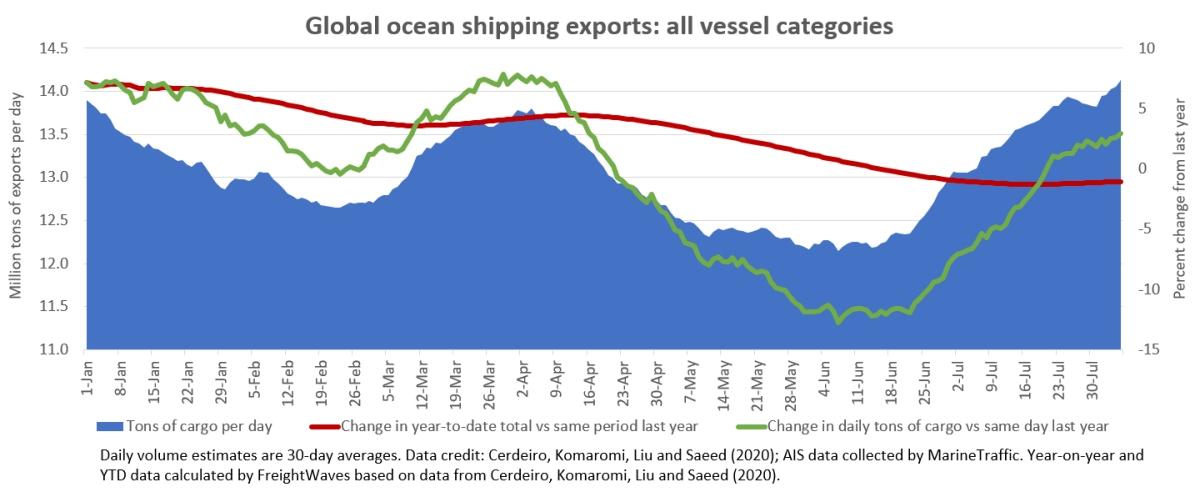
The year began on a positive note, with volume up by the mid-single digits. The post-Wuhan-lockdown bounce-back was strong. It was the Western lockdowns that hurt the most, bringing daily global exports down by the low double digits at the June nadir.
Daily export volumes recovered and were up 3% year-on-year as of the first week of August.
The change in YTD total volume may be a better indicator of performance for ship operators and ports. For the period Jan. 1-Aug. 5, total global exports were essentially flat versus the same period last year, down 1%.
The YTD total has stopped falling, has stabilized and is edging in a positive direction. Rebounding exports driven by the reopening of Western economies are on the verge of bringing the YTD total back into the black.
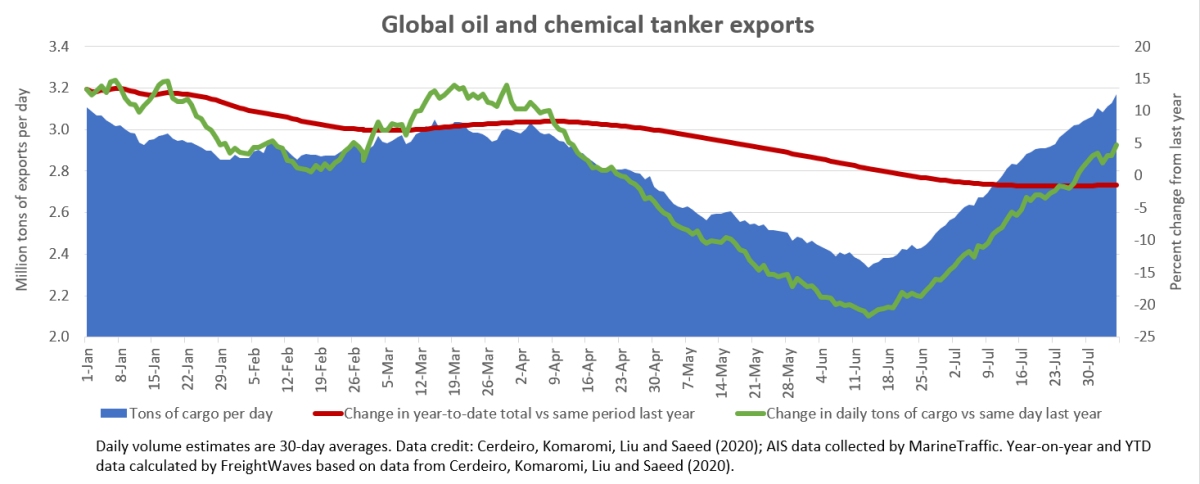
Tanker effects
Exports of crude, products and chemicals represent 21% of seaborne volumes YTD (through Aug. 5), according to the research dataset. Of all shipping categories, the tanker segment gets the most attention from investors.
The data shows a jump in exports in March, when talks between Saudi Arabia and Russia collapsed and producers opened their spigots. This is followed by a sharp fall in global tanker exports in the second quarter, as the OPEC+ coalition agreed to cut production, falling prices pared production among non-coalition nations and earlier export volumes remained tied up in floating storage.
The data then shows a sharp rebound in exports in July and early August, bringing year-on-year comparisons into positive territory as of this month (although the year-on-year percentage may be inflated by “easy comparables” versus seasonal weakness in 2019). From a YTD perspective, total volumes were still down 1.4% as of Aug. 5.
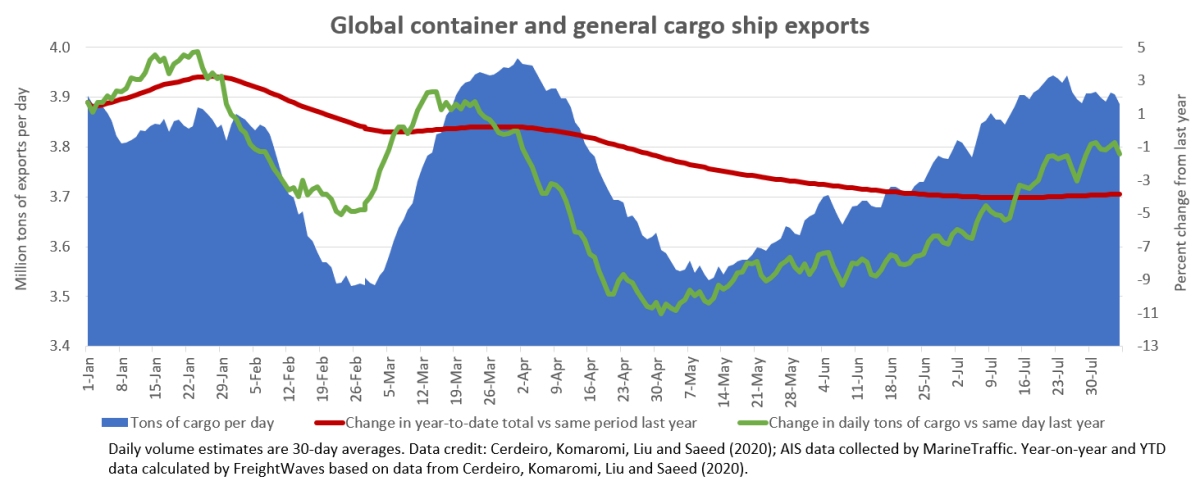
Container-shipping effects
Exports of containerized goods and general cargo represented 29% of estimated volumes through early August. Cornavirus has affected container exports even more heavily than tanker exports.
The IMF team’s data shows a more pronounced double-valley pattern for container exports than for any of the primary volume categories.
Container exports fell by almost 10% globally over the course of February as the virus shut down Chinese outbound cargoes. Volumes snapped back in March but slid all the way back down again through April and early May as import regions locked down and carriers canceled sailings (volume effects were felt in U.S. import ports later, in May and June, due to ocean transit times).
Global containerized export volumes had bounced back to January levels by late July and early August, but were still down 1.4% year-on-year as of Aug. 5 and down 3.8% YTD versus the same period in 2019.
US container strength
Container lines report depressed demand in South America but resurgent flows to other markets, particularly the Asia-U.S. West Coast market. The IMF team’s data confirms the strength of U.S.-China volumes.
Container volumes are difficult to judge year-on-year. First, the timing of Lunar New Year (LNY) varies. Second, U.S. tariffs affected 2018-19 numbers. To address these issues, the IMF staffers indexed 2020 daily volumes to the 2017-19 average, adjusted for Lunar New Year (see link to data here, including all of the raw data for the entire project; see easy-to-use UN Comtrade dashboard here).
This perspective shows a plunge of more than 25% in Chinese containerized exports in the wake of the Wuhan outbreak, but a drop in U.S. imports of only 10% (with a lag effect due to ocean transit times). American-bound boxes rebounded from that initial shock, then fell to 15% below average by June due to consumer lockdowns.
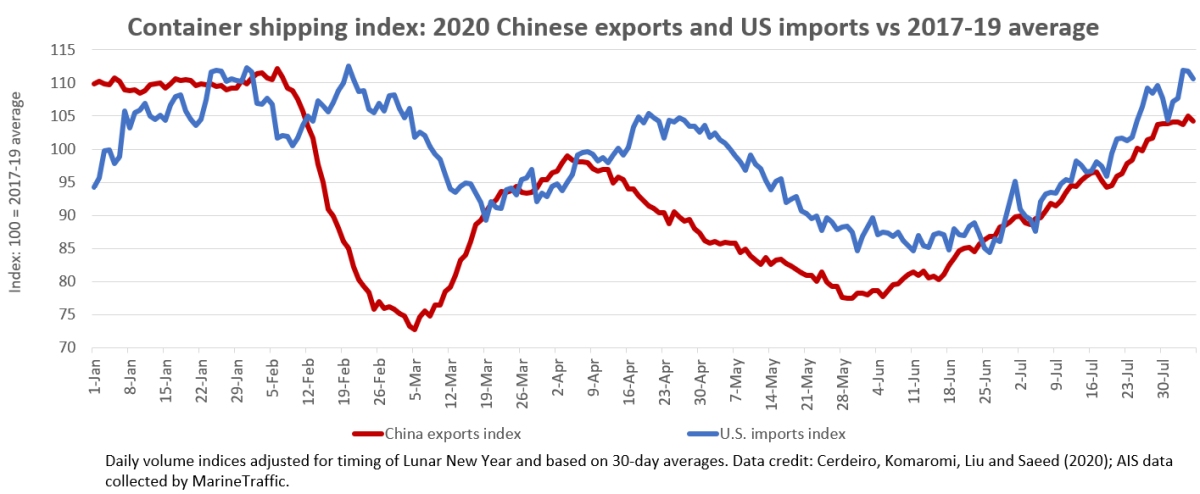
Trend lines for Chinese exports and U.S. imports have closely followed each other since early July. As of Aug. 5, U.S. box imports were 10% above average and Chinese exports 4% above average.
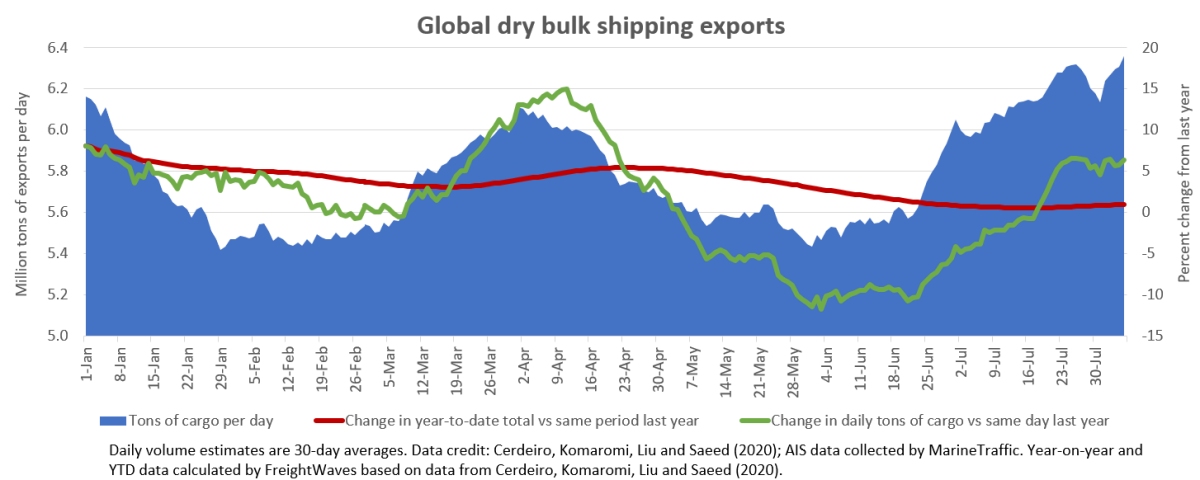
Dry bulk volumes
Dry bulk shipping — led by iron ore, coal and grains — is by far the world’s largest freight market by volume. It accounted for 44% of volumes in the IMF team’s YTD data.
Dry bulk exports rose off first-quarter lows in April, then sank, then came back up in recent months. More so than other sectors, dry bulk exports have been affected by seasonal and other non-coronavirus issues. The ebb and flow in the data is roughly in the same direction as spot rate trends. The data shows YTD cargo volume are essentially flat (up less than 1%).
Still ‘experimental’
The caveat to the new free product from the IMF team is that it is openly described as “experimental.” (See link for methodology.) There are ongoing refinements and all estimates are subject to change.
The authors’ disclaimer: “These estimates are not official IMF statistics and were not endorsed by the IMF or its executive board. These estimates were produced by staff in the context of [a] research project and should be interpreted accordingly.”
Indeed, industry insiders may look at the curve of the recent dry bulk and tanker volume gains in the datasets and deem them too steep in light of freight rates.
The tanker data loses quite a bit of its value due to its mixing of crude and product carriers into one category. And on the container side, use of AIS data is inherently questionable for cargo estimates: Unlike with laden bulk ships, it is very difficult to estimate how much cargo is aboard a container ship, while algorithms based on past utilization rates break down during one-off events like pandemics.
But despite its shortcomings, the new shipping data offering — so new it doesn’t even have a brand name — stands out.
Never before has this much ship-positioning data been available to the general public, amalgamated by ship type and country and easily downloadable … without a price tag attached.
How the Top Container Lines Manage Capacity and Profitability
In the previous article, we summarized the state of the shipping line industry from a macro perspective. We take a detailed look here on how shipping lines manage profitability.
Up till the beginning of 2020, most shipping lines were absorbing losses on their books despite doing their best to increase vessel utilization percentages. Due to this, carriers have looked at other ways of reducing their costs further and increasing their margins.
The first way is through fuel consumption management, which makes up as much as 50 to 60 percent of a vessel’s operational expenses. The most popular way to do so is through slow-steaming which involves deliberately slowing down a vessel to reduce fuel consumption when prices are high. Slow-steaming is done when fuel prices are increasing which impacts the market with slower ship speeds and therefore longer transit-times which correspond to higher unreliability.
The second way is installing scrubbers, which are a one-time investment, instead of buying LNG or very low-sulphur fuel on the spot market.
The third way is to blank sailings and roll over containers for a sailing if the vessel is under-utilized. Time and again, carriers have exhibited a tendency to proactively cancel sailings in advance and then later re-insert capacity if there’s more demand, rather than waiting for demand to increase first before making a decision to roll-over a sailing.
The fourth tactic is to idle ships at sea as part of capacity reduction efforts in a network to prop up freight prices. This allows carriers to quickly re-introduce capacity when demand surges.
The fifth tactic is actually the opposite of the first and works when fuel prices are dropping. This involves taking longer alternative sailing routings to bypass toll fees but speeding up ships. As a general rule, fuel consumption is directly proportionate to vessel speed increases by a power of three. An example of this is when shipping lines travelling between Asia-Europe on both directions decided to take the longer routing via the Cape of Good Hope in South Africa instead of the shorter route through the Suez Canal. The difference in extra distance travelled was approximately 3,500km. With bunker prices at all-time lows, the savings from burning cheaper fuel versus paying a $700,000 toll fee were tremendous. Furthermore, shipping lines were even willing to speed up and cut the additional transit time of 7 to 10 days on this route to 3.5 days.
When all else fails, carriers resort to scrapping ships that have not yet reached their maximum lifespans. Longer-term strategies include vessel operators adopting a more variable cost structure in their balance sheets through a greater proportion of leasing charters from third party owners as opposed to owning their own vessels. In bad times, such vessels can be easily returned to owners and the relevant sailing routes blanked accordingly.
Bunker-fuel hedging is another crucial strategy employed by carriers to manage fuel costs, but these costs are hedged only one way with their suppliers. The same hedging option is not extended to their shippers, resulting in beneficial cargo owners having to rely on monthly bunker variances as a component of their freight costs. This leaves shippers very little alternative but to ride the market volatility through the peaks and troughs.
However, when bunker fuel levels hit zero and even went into historic negative territory of USD -$38.45 /barrel3 in April of this year, the shipping lines were slow and reluctant to pass on those savings to their clients. Instead, they re-adjusted their bunker trade factor calculations and formulae to maintain their margins.
A quick note on how these formulae are derived: the premise for calculations are not a simple matter as it involves the division and allocation of the total fuel consumption costs of both legs of a particular carrier sailing loop. Both the head haul and back haul routings of a sailing loop must share the fuel burden, but by how much depends on the shipping line's own calculations. These calculations weigh the individual fuel costs, vessel profitability and volume of each haul against what their competitors are doing. This makes it difficult to coordinate a standard industry bunker formula because each carrier has varying cost inputs - and also of course because of market regulation laws that prevent any form of collusion.
The different formulae factors have naturally led to large rate differences and much confusion amongst shippers. In an effort to clear up this confusion and make things as easy as possible, some large forwarders have developed their own bunker formulae on monthly rolling averages to bring more transparency and predictability into the industry.
The effect of carriers re-adjusting their bunker formulae in crises, though not unexpected, had an unsettling effect on customer expectations of long-term contract rates. It was yet another salvo fired against the integrity of long-term contracts—though most of these contracts were never iron-clad to begin with—between shipping line and shipper to buffer against the shocks of rate volatility. This brings into question the very intent and purpose of having a long-term contract to guard against such fluctuations in the first place.
Shipping lines have employed all kinds of ways to safeguard against losing money on a contract that has turned negative. (A negative contract is a contract that will result in financial loss for the carrier due to market fluctuations.) This includes citing lack of space and equipment availability at the time of booking, thereby allowing them to turn down a booking which would result in a loss. This is a default clause in almost all contracts. In the early days of the pandemic, force majeure clauses were frequently cited and used to break away from previously agreed long-term contracts.
A combination of these measures during and outside of crises allows shipping lines to mitigate all and any downside on a negative contract. However, it is not to say that all such contracts are one-sided. An example of a common and fair two-way standard clause allows carriers/shippers to re-negotiate the rate levels if variances move up or down by 10 percent.
Freight rates are fleeting and volatile, but any supply chain director or procurement chief worth their salt knows getting a long-term partnership with the right forwarder or shipping line on the basis of trust and transparency will save them and their organization more money, time, effort, and trouble than they could ever imagine.
Carrier tactics at managing profitability have resulted in increasingly unreliable transit times for shippers, notwithstanding the fact that many carriers have dabbled with insolvency or rumours of it in the past. Some carriers can continue along this path of unprofitability because they have been continuously propped up by vested government and nationalist interests, but it remains to be seen for how long and through what kind of market cycles such policies can continue.
Shipping line profitability remains inherently unstable and will continue to be so until more capacity rationalization occurs through mergers and acquisitions, a reduction of new vessel build orders, or a twofold increase in global market growth. the last of which is highly unlikely due to the pandemic.
The effect of a consolidating carrier market has a mixed-effect on the global forwarder market. On one hand, it brings about stability to the industry - which is a good thing because that translates into higher transit time reliability, which is ultimately beneficial to shippers. Consolidation also means lesser carrier vendors, which results in higher freight rates. This is not necessarily a good thing for shippers but it’s a trade-off for an inherently stable and reliable service. If shippers could be assured a higher freight rate would translate to less volatility and more predictability for their supply chains, they may be more receptive to such increases.
On the other hand, a shrinking pool of carriers is not good for shippers and forwarders because the lack of competition means a lack of diversified routing choices and reduced bargaining power. All said, there is appetite and room for more consolidation when the worst of the pandemic is over if an enticing deal can be found.
Alliance structure hampers expanding container line offerings
The past six months have clearly shown the value alliances provide to their member carriers in terms of managing capacity in the face of extreme demand volatility. It would be easy to look at length at how the carriers benefit from this in terms of higher freight rates right now, but in a complex industry there are always multiple simultaneous developments and a one-eyed focus on a single element leads to a risk of being blindsided by another.
If we look slightly further ahead, beyond the pandemic impact, we are still in a market where the networks on the main deep-sea trades are designed by the three major alliances. This also means that the port-to-port shipment between major locations is a pure commodity. It is difficult to upsell a commodity, and hence carriers will be working on other parameters to differentiate their service offerings beyond the pure ocean part.
The problem with an alliance is that it restricts the ability to differentiate on some service elements beyond the ocean simply because the ocean link is not always under a carrier’s own control. It does not prevent a carrier from developing improved solutions, but it limits their ability to do so. This is best illustrated with an example from a bit over a week ago.
CMA CGM announced an expansion of their service offering, and this serves as a good example of both how carriers are approaching the development of improved solutions, but also how the alliance structure in these cases can be seen as a hindrance.
Their new offerings, termed SEAPRIORITY get and SEAPRIORITY reach, promise priority unloading and terminal fast track to allow a quick turn time at the destination port. Furthermore, it has fast inland connections attached to it. In principle, a good approach to provide faster delivery times. Whether this is attractive or not is basically up to the customers to judge based on their needs, but it is yet another indication that carriers are attempting to differentiate — or improve — services on the land-side connections.
Expanded services require strong operational control
However, it also exemplifies how carriers are challenged in such cases by the alliance structures. This new service is only offered on three trans-Pacific services and only into the Fenix terminal in Los Angeles. These three services are operated by CMA CGM and not their ocean alliance partners, and CMA CGM also retained a 10 percent ownership stake in the Fenix terminal following its sale in 2017.
Operationally, handling such priority promises does require a strong operational control. This would imply that CMA CGM does not believe their partners can (or will) execute on the priority operational promises on services not under CMA CGM control. And hence it is a good example that alliances serve the carriers well in terms of cost efficiencies, but becomes a challenge in relation to expanded service offerings.
However, for the shippers this might also lead to a situation where they might want to broaden their portfolio of carriers in the future in order to avail themselves of non-commoditized services offerings beyond the ocean part, and in doing so it would not be sufficient to be “exposed” to only a single carrier in each alliance.
APL Co. Pte Ltd – Change of Name with effect from 1 December 2020
With effect from 1 December 2020, the name of APL Co. Pte Ltd shall be changed to CMA CGM Asia Shipping Pte. Ltd. The name change does not affect the company’s business, shareholder structure, management, contact details, or agreements it has entered into.
APL Co. Pte Ltd has been part of the CMA CGM Group since 2016. The name change is in line with the developments that the CMA CGM Group has been making across its trade lanes and among its carrier brands over the last 3 years. The changes will mark a new phase of growth for the CMA CGM Group as a global shipping and logistics leader.
Since only the company name changes, but all other legal aspects remain unchanged, please consider this letter as an amendment to any agreement that are currently in place between yourselves and APL Co. Pte Ltd. We would be grateful if you could ensure that all contact details and communication systems are updated within your organisation to reflect our company’s new name with effect from 1 December 2020.
Speeding up process of handling of backlogged goods as scrap at Vietnam seaports
For classification and reporting of classification results, the General Department of Vietnam Customs requested Hai Phong Customs Department and HCM City Customs Department complete the classification, inspection and report the results to the General Department of Vietnam Customs. HCM City Customs Department must urgently conduct cargo inspection to complete classification and accurately identify backlogged goods.
For auctions of consignments which have completed classification and accurately identified goods as scrap on the list under Decision No. 73/2014/QD-TTg and meet national technical regulations on the environment, the General Department of Environment announced the list of establishments that have been granted the certificate of eligibility for environmental protection in importing scrap for use as raw production materials to participate in auctions of shipments of backlogged scrap. Therefore, the General Department of Vietnam Customs transferred the list of enterprises to the provincial Customs Departments to notify businesses to submit dossiers to participate in the auction.
For the consignments that have completed the classification, inspection and accurate determination of scrap on the list under Decision 73/2014/ND-CP and meet national technical regulations on the environment, provincial Customs Departments will conduct auctions in accordance with regulations for enterprises on the list of the General Department of Environment.
For shipments that have not been classified or assessed yet and have not been identified accurately as scrap listed on the list under Decision 73/2014/ND-CP and meet national technical regulations on the environment, the provincial Customs Department urgently classify and inspect to finish handling of backlogged scrap at seaports.
Regarding re-export of scrap containers identified as waste, hazardous waste or scrap that fails to meet national technical regulations on the environment, the General Department of Vietnam Customs requested that before re-exporting backlogged scrap, the provincial Customs Departments should make a list and report on the shipping lines/shipping agents, container numbers and seal numbers to the General Department of Vietnam Customs to review and set up management criteria.
After the General Department of Vietnam Customs has reviewed and set up management criteria, they will issue documents to instruct the provincial customs departments and shipping lines/shipping agents to re-export the backlogged scrap.
The provincial Customs Departments also requested shipping lines/shipping agents to commit to re-export all backlogged shipments identified as waste, hazardous waste, and scrap failing to meet national technical regulations on the environment out of the Vietnamese territory to avoid taking advantage of re-exporting only recyclable goods and leaving non-recyclable goods at Vietnamese seaports, causing environmental pollution.
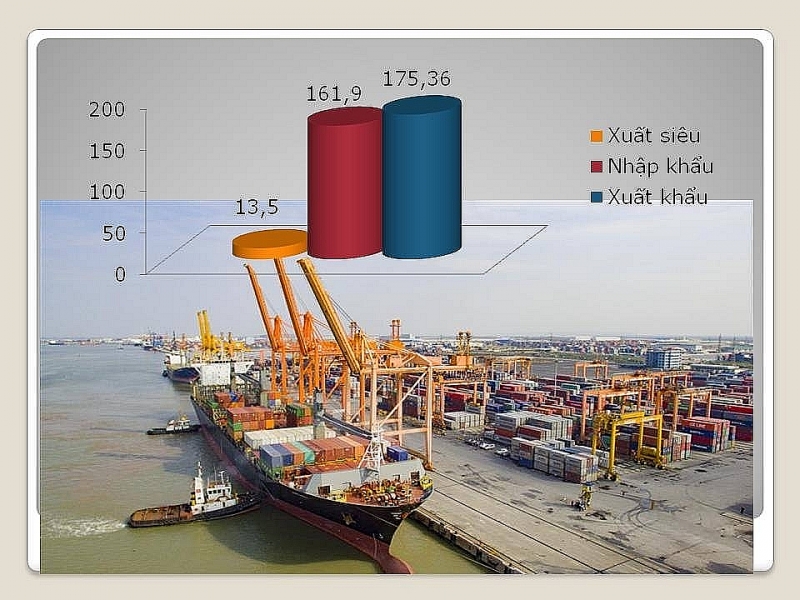
Vietnam achieves record trade surplus of $13.5 billion
VCN – Import - export turnover in August topped $50 billion and the trade surplus stood at a record of nearly $13.5 billion.
|
Structure of import - export turnover in the first eight months of 2020. Sketched by T.Bình |
The figures on import and export were announced by the General Department of Vietnam Customs on September 14.
In August, Vietnam's total import and export value reached $50.4 billion, with a total export value of $27.7 billion, up 11.4% and the total import value reached $22.7 billion, up 2.8% over the previous month.
With the prosperity in August, total value of import and export goods of Vietnam in the first eight months of the year reached $336.92 billion; of that total export value reached $175.36 billion, up 2.3% and total import value reached $161.9 billion, down 2.4% over the same period in 2019.
So, in the first eight months of the year, the trade balance reached trade surplus by nearly $13.5 billion, higher nearly 2.5 times than the surplus in the same period in 2019 ($5.47 billion).
In August, phones and components led in export turnover and also had a high increase compared to July with the result of nearly $5.35 billion, up by 24.8%. However, for the first eight months of the year, although this group still maintained its top position (reaching nearly $31.6 billion), turnover decreased by 5.4% over the same period in 2019.
Besides phones and components, in August, there were five other export commodity groups with a turnover of $1 billion or more, including computers, electronic products and components with $4.2 billion (up 3.4%) compared with July 2020; textiles and garments reached nearly $2.97 billion (down 2.5%); machinery, equipment, tools and spare parts reached nearly $2.7 billion (up 17.6%); footwear nearly $1.4 billion (up 1%); and wood and wood products reached $1.15 billion (up 1.9%).
In terms of import, the largest commodity group was computers, electronic products and components with a turnover of more than $6 billion, up 7.6% over the previous month. Generally, in the first eight months of the year, this group of goods reached $38.75 billion, up 15.6%, continuing to be the largest imported commodity group of Vietnam.
Source: Shipping Lines' websites, JOC.com, Vietnam Customs
.jpg)
.jpg)